


Processes & Products
Reliably monitor machine status
| Michael Birchler
Latest version of AnalytiX with practical enhancements
Time is money! Without the right tools, monitoring and analyzing the condition of machines can be a protracted and resource-intensive process. AnalytiX gives users live access to current machine status and enables them to rapidly identify optimization potential.
Version 2 of AnalytiX has been operational since the middle of the year. Within the scope of further updates, three practical innovations have since been added to promote efficient monitoring and analysis.
Smart Operation status
Using the intuitive 4-button control system, Smart Operation enables guided, fast and safe injection molding machine operation within the production environment. Operating errors and any resulting downtime are reliably prevented and system efficiency is further increased. Integration within AnalytiX enables you to monitor the real time Smart Operation status of your machines anytime and anywhere: Production Ready On Standby Off

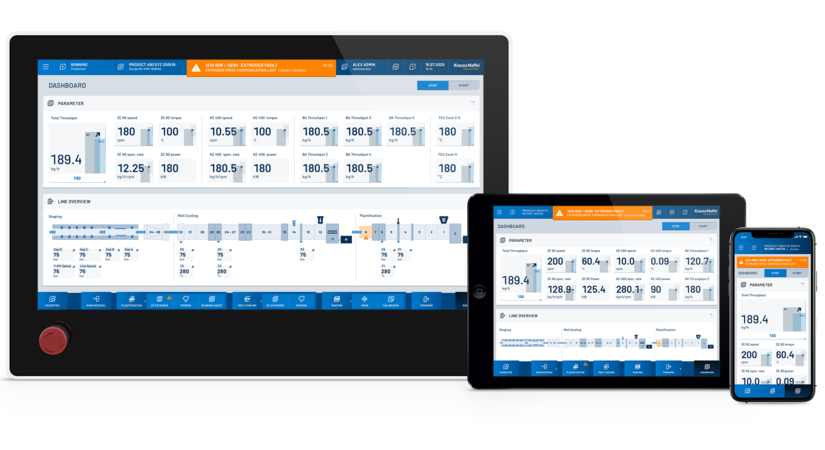
Smart Operation integration
Integration of AnalytiX enables real-time Smart Operation status checks. This example shows the machine in 'Production' status, indicated by the blue bar on the right.
Optimization analysis
An overview of all operating messages within the last 24 hours is displayed for your machine park. The graph shows the messages that appear most frequently and which machines they stem from. For a more in-depth analysis, operating messages for the last four days can be retrieved for each individual machine.

Rapid identification of optimization potential
Machines with operating messages within the last 24 hours
Downtime heat map
In football, a heat map allows a plethora of data to be explicitly visualized during and after a match. Which areas of the field did individual players or the team as a whole prefer to move around? Colorful highlighting of the most frequently visited zones quickly answers this question.

Practical heat map
Explicit chronological visualization of downtime. This example shows irregularity on a Sunday evening. A few hours later production is fully up and running again.
The downtime heat map in AnalytiX is based on this principle and illustrates days or hours of reduced performance in orange and red. A four-week review helps you quickly identify the days on which downtime occurred. The weekday heat map allows you to establish the time periods in which the machine failed to produce. AnalytiX heat maps enable you to effectively save time during the analysis and categorization of downtime causes and re-establish maximum productivity more quickly.
Trouver des articles sur des sujets similaires:
CES ARTICLES POURRAIENT VOUS INTERESSER
Prelude to K 2022 – Make plastic green
24.07.2026 | Petra Rehmet, Andreas Weseler, Uli Pecher, Gerhard Konrad